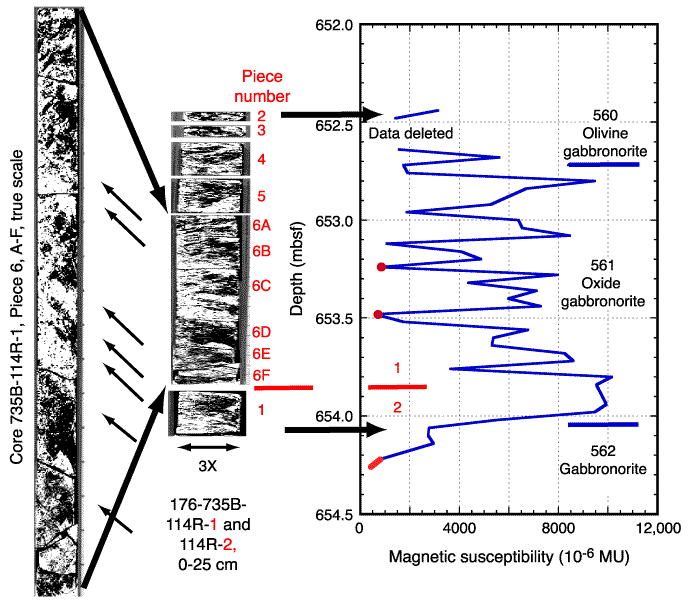
Figure F14. Magnetic susceptibility vs. depth for a peak region between 652.5 and 654.5 mbsf, spanning portions of Sections 176-735B-114R-1 and 11R-2. Lithologic intervals and rock identifications are given to the right. Background measurements are dots and bolder line on the left side of the curve. The plot is compared to a larger image for Pieces 6A-F, from the corresponding core photograph (far left), with strong contrast enhancement showing the distribution of oxide-rich portions of the core (black). The central image is compressed and widened (3x) to correspond to the vertical depth scale of the plot of magnetic susceptibility. Other pieces are added to show how the oxide-rich portions of the core correspond to susceptibility peaks. Small arrows next to the image on the left indicate boundaries to oxide-rich portions of the core that are aligned and steeply dipping in the same direction.


![]()