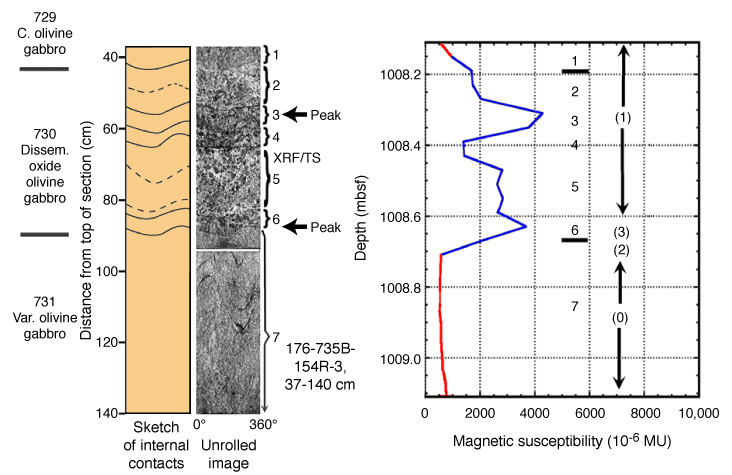
Figure F15. Magnetic susceptibility vs. depth for a peak region between 1008.1 and 1009.1 mbsf, spanning interval 176-735B-157R-3, 37-140 cm. Background measurements are the flat parts of the curve on its left side. Lithologic intervals and rock identifications are given on the far left. This is compared with an unrolled core scan and a sketch indicating tops and bottoms of subintervals, which are numbered to the right of the core scan and in the plot of magnetic susceptibility. Some contrast enhancement has been applied to the core scan. Numbers in parentheses on the plot of susceptibility vs. depth give the deformation intensity. Peaks in magnetic susceptibility correspond to subintervals 3 and 6, pointed out by arrows adjacent to the core-scan image. XRF/TS = X-ray fluorescence/thin section.