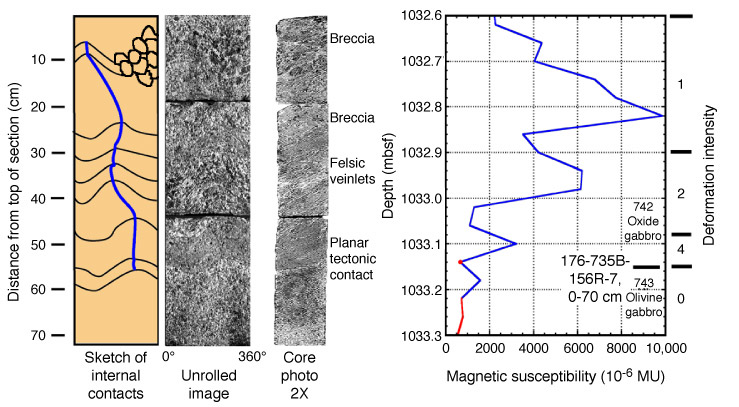
Figure F16. Magnetic susceptibility vs. depth for a peak region between 1032.6 and 1033.3 mbsf, spanning interval 176-735B-156R-7, 0-70 cm. Background measurements are given by the dot and the flat part of the curve below 1033.2 mbsf. Lithologic intervals and rock identifications are given on the right side of the plot and deformation intensities on the far right. These are compared with an unrolled core-scan image and the corresponding core photograph, the latter widened by 2x. Some contrast enhancement has been applied to both images. On the left is a sketch of subinterval contacts within lithologic interval 742 from the unrolled image.