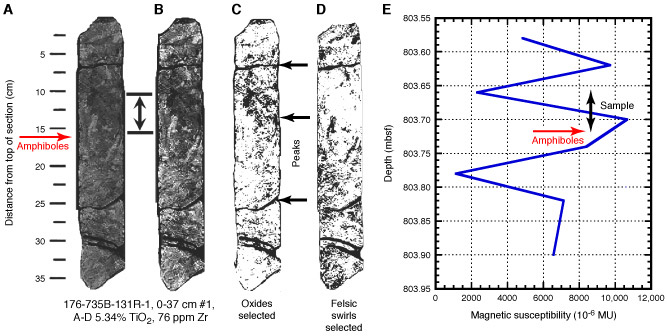
Figure F22. A portion of the core photograph for interval 176-735B-131R-1, 0-37 cm, an oxide gabbro that provided three peaks in magnetic susceptibility. A. No contrast enhancement; the double-headed arrow gives the interval for an analyzed slab sample reported by Snow et al. (Chap. 12, this volume). B. Same image with greater contrast, showing both oxide-rich material (black) and swirls of felsic material (white). C. Same image, with oxides selected. D. Same image, with felsic swirls selected. E. Magnetic susceptibility vs. depth. The analyzed rock has 4.34% TiO2 from the oxide minerals and 76 ppm Zr, from the felsic swirls.