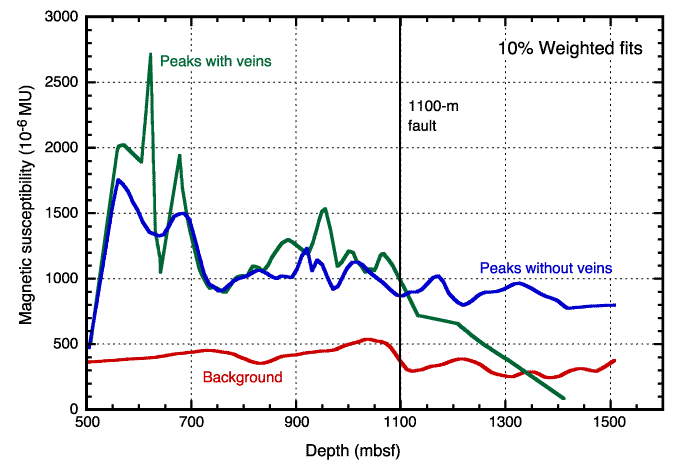
Figure F26. Comparison of 10% least-squared weighted curves of magnetic susceptibility vs. depth, from 5000 to 1500 mbsf, for background measurements, peaks, and peak regions without felsic veins and peaks with veins as labeled. The result of the curve fit is to plot a best fit smooth curve through the center of the data. Here it shows that felsic veins have comparable or even higher magnetic susceptibility than oxide gabbro seams (peaks) without such veins. The fault at 1100 mbsf is shown by the vertical black line.


![]()