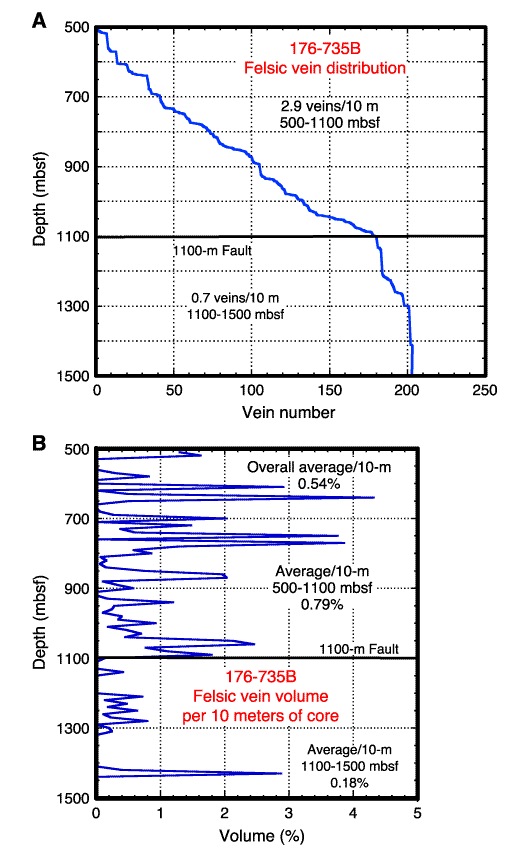
Figure F27. A. Vein number, sequenced from the vein-log spreadsheet (supplementary material to the site report (Shipboard Scientific Party, 1999b) vs. depth from 500 to 1500 mbsf, showing the contrast in vein frequency above and below the fault at 1100 mbsf. B. Felsic vein volume per 10 m of core vs. depth, also from the vein-log spreadsheet.