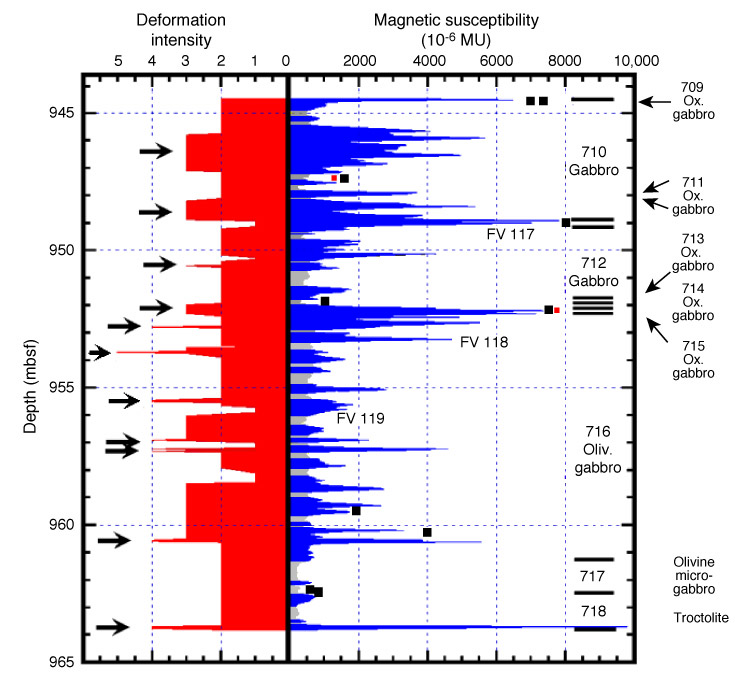
Figure F28. Comparison of magnetic susceptibility (right) with crystal-plastic deformation intensity (left) for a portion of core from 944.5 to 964 mbsf plotted vs. depth. On the right, peaks and peak regions are contrasted in color or shade with lower background measurements. Lithologic intervals by number and rock identifications are also indicated on the right, as are occurrences of three felsic veins (FV). Large squares give locations of samples taken for rock analysis (from Shipboard Scientific Party, 1999b, Niu et al., Chap. 8, this volume; Snow et al., Chap. 12, this volume). Small squares give locations of thin sections shown in Figure F29.
On the left, deformation categories are 0 = undeformed; 1 = slightly deformed; 2 = banded or gneissic; 3 = porphyroclastic; 4 = mylonitic; and 5 = ultramylonitic. Deformation categories are averages for given intervals, giving the diagram its stepwise character. Arrows on the left identify strongly deformed rock corresponding to susceptibility spikes on the right.