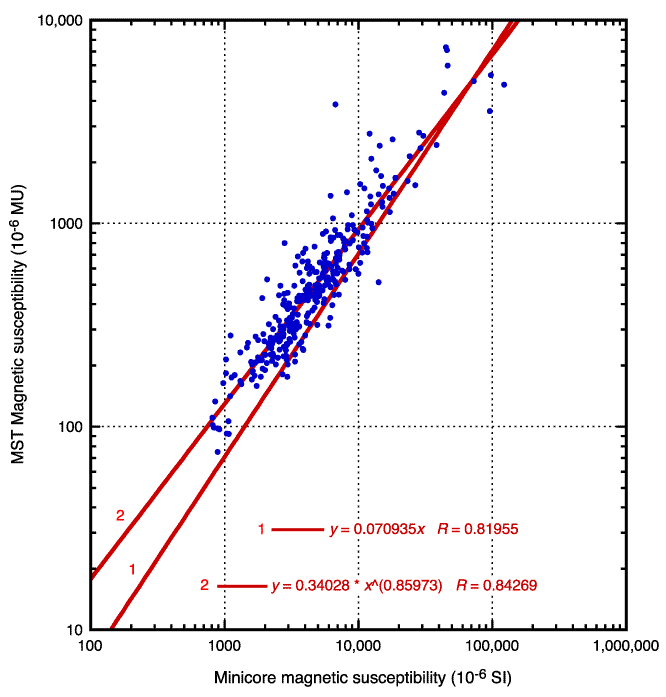
Figure F3. Magnetic susceptibility of minicores vs. magnetic susceptibility of the corresponding interval measured by the Bartington sensor on the MST. The linear regression (equation 1) is slightly curved on this log-log variation diagram, whereas the power-law regression (equation 2) is a straight line.


![]()