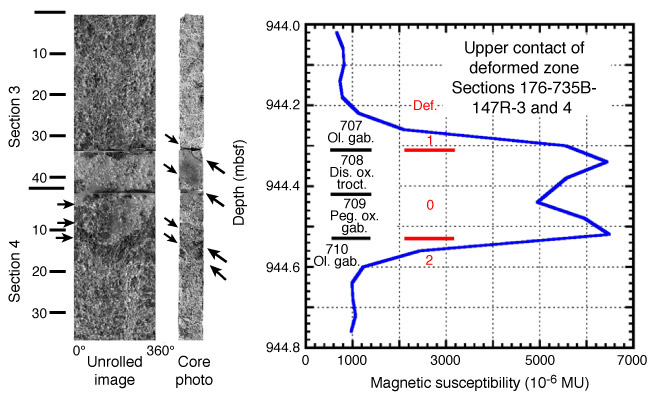
Figure F30. Portions of Sections 176-735B-147R-3 and 147R-4, showing the upper contact of the deformed region of core from Figure F29.
The unrolled scanned image and the corresponding core photograph of the split surface of the rock are on the left. Magnetic susceptibility vs. depth is on the right. Inclined contacts between lithologic units are indicated by arrows next to the core photograph. Lithologic intervals, rock lithologies, and intensities of deformation are given on the diagram of susceptibility vs. depth.