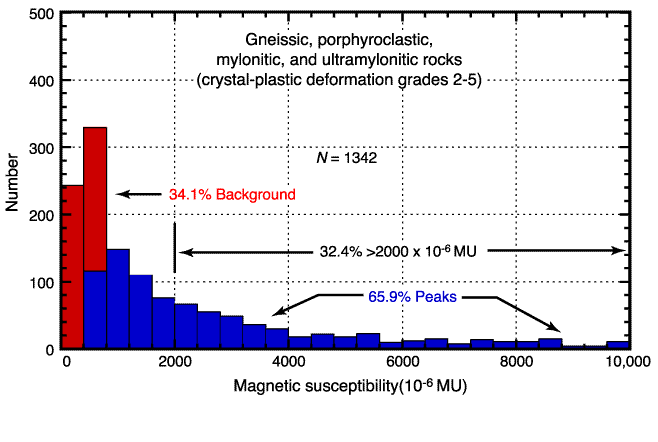
Figure F31. Magnetic susceptibility histogram for strongly deformed rock. The histogram represents the values of susceptibility measurements corresponding to deformation grades 2-5 in bins of 400 x 10-6 MU. Peaks represent 65.9% of the measurements and background measurements 34.1%. Strong peaks corresponding to oxide gabbros (>2000 x 10-6 MU) are 32.4% of the measurements.


![]()