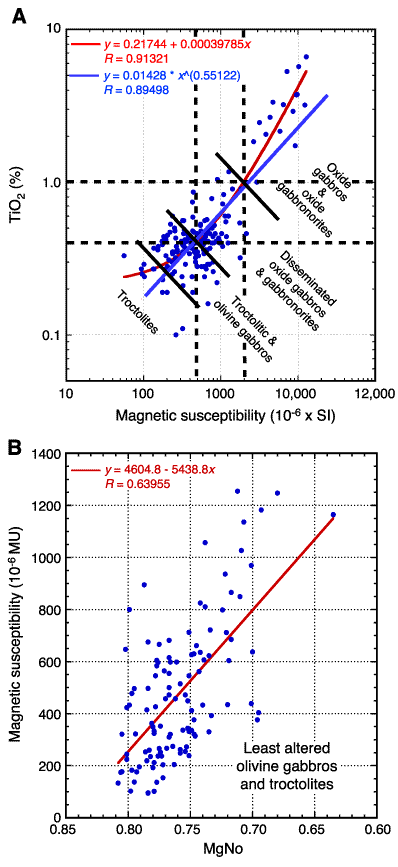
Figure F33. A. Log-log diagram of magnetic susceptibility (x 10-6 MU) vs. TiO2 for all gabbros of Hole 735B. Both linear and curving power-law regressions are shown. Diagonal black lines divide the rocks into principal lithologic types. TiO2 values are from shipboard XRF data (Shipboard Scientific Party, 1999b). Magnetic susceptibility is taken as the value closest to the center of the ~5-cm-long sample taken for each sample B. MgNo (= Mg/[Mg + Fe2+] with Fe2+ determined by titration) from shipboard analyses vs. magnetic susceptibility (x 10-6 MU) for least altered olivine gabbros and troctolites (TiO2 <0.7%) from Hole 735B. A linear correlation (r = 0.64) is shown by the line.


![]()