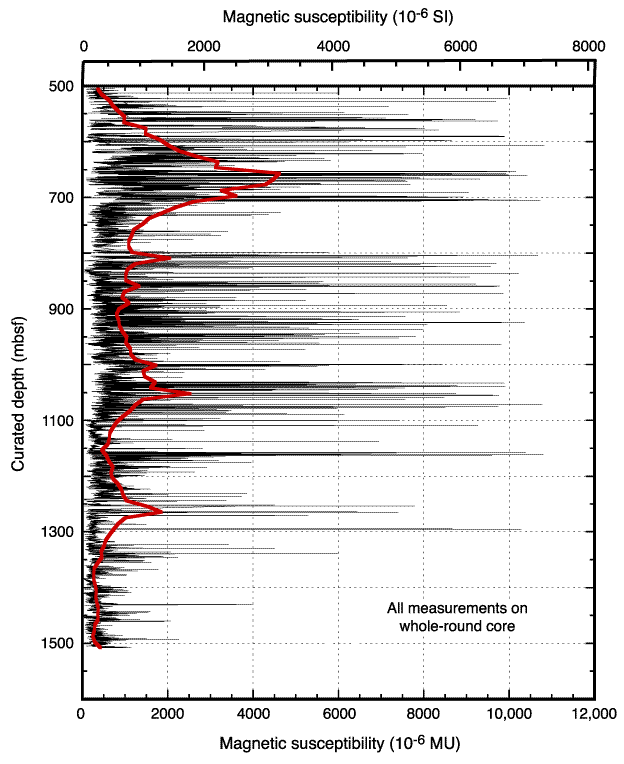
Figure F4. MST magnetic susceptibility vs. depth, edited as described in the text. The scale at the top is in SI units, corrected by the factor of 0.66 from the scale in machine units (MU) at the bottom, as discussed in the text. The thick line gives a smoothed fit to the data, binned over 20-m intervals, as calculated using the plotting program,
Kaleidagraph.


![]()