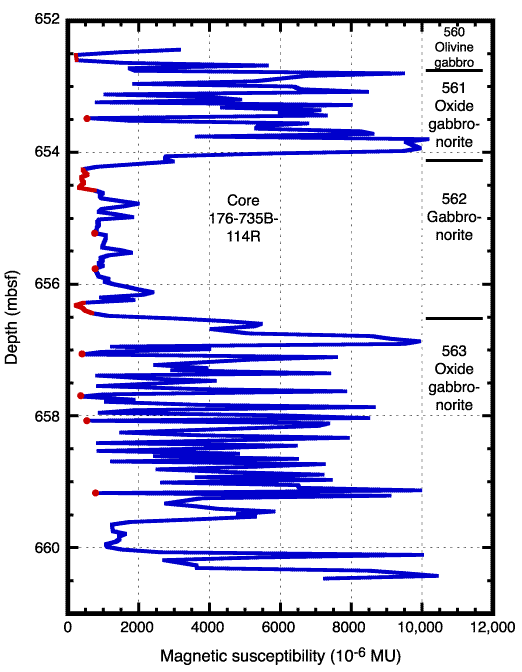
Figure F6. Magnetic susceptibility vs. depth for two peak regions between 652 and 662 mbsf. Background values are in red. Lines are drawn between each data point that has not been edited.The corresponding lithologic units and rock identifications are to the right, as taken from the igneous rock description forms in the site report (Shipboard Scientific Party, 1999b).


![]()