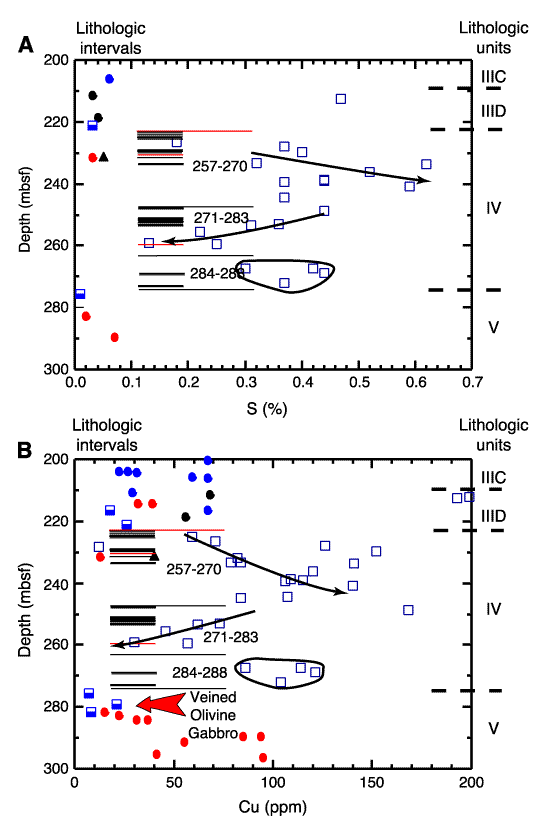
Figure AF7. Variations in (A) S and (B) Cu with depth between 200 and 300 mbsf, highlighting intervals in lithologic Unit IV. The narrow arrows show general trends of increasing extent of differentiation with depth. In B, where no trend exists, the corresponding data points are circled. The broad red arrow indicates veined olivine gabbro at the top of Unit V.


![]()