![]()
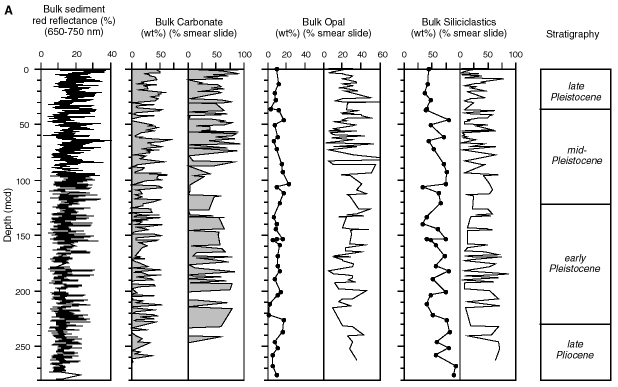
Figure F5. A. Comparison of downhole compositional variations at Site 1089 based on smear-slide (percent area), OSU-SCAT (red reflectance), coulometry (carbonate), and XRD (opal) estimates. Frames from left to right: red reflectance (650–750 nm), coulometric, and smear-slide estimates of carbonate abundance (nannofossils + foraminifers on smear slides); opal and diatom abundance; mud and terrigenous sediment; and chronostratigraphy. (Continued on next page.)
![]()