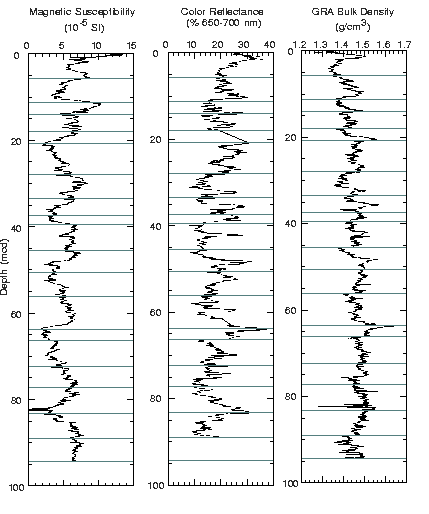
Figure F17. Spliced records of magnetic susceptibility, color reflectance, and GRA bulk density for the upper 100 mcd of Site 1089. All three data sets were smoothed with a 5-point running mean. The horizontal lines in each plot identify the splice tie points. Note that the color reflectance data are not continuous as color data were not collected on all cores used for the sampling splice.
