![]()
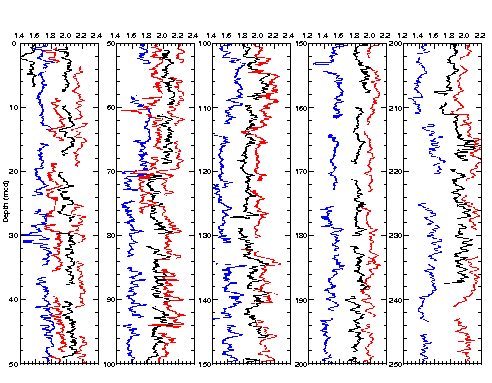
Figure F11. Smoothed (5-point average) GRA bulk density data for the upper 250 mcd at Site 1090. Holes 1090A (left curve), 1090B (second from left curve), 1090C (middle curve), 1080D (second from right curve), and 1090E (right curve) are horizontally offset from each other by a constant (0.15 g/cm3). Data from the top 20 cm of each core have been removed.
![]()