![]()
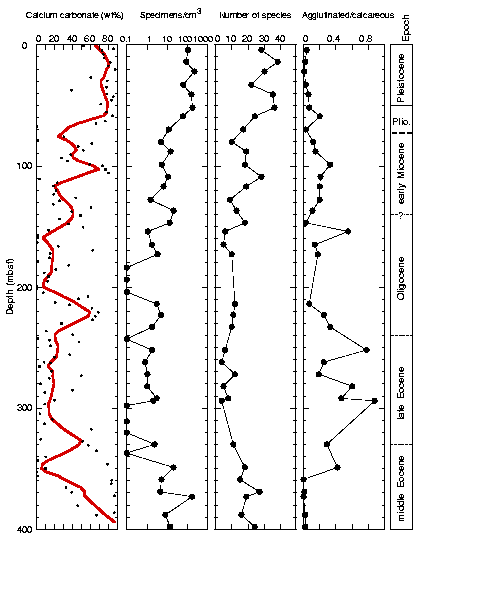
Figure F16. Smoothed (solid line = locally weighted least-squares fit, incorporating a sliding window that includes 7% of the data) and measured (points) CaCO3 concentrations plotted vs. the number of specimens/cm3, the number of species, and the ratio of agglutinated to calcareous taxa in each sample studied for Hole 1090B.
![]()