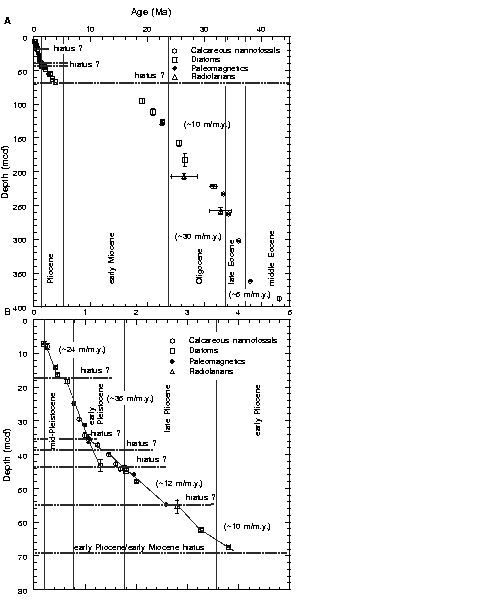
Figure F19. Age-depth relationship integrating biostratigraphic and geomagnetic polarity data for (A) the entire sedimentary section and (B) a close-up of the upper 70 mcd at Site 1090. The solid lines indicate a visual best fit through the age-depth control points (Table T9, p. 89). Corresponding sedimentation rate averages are given in parentheses.
