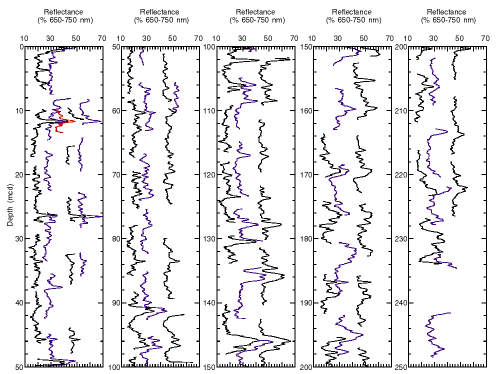
Figure F12. Smoothed (5-point average) color reflectance data (650-750 nm) from Site 1091. Holes 1091A (left curve) and 1091B (second from left curve) are OSU-SCAT data; Holes 1091C (middle), 1091D (second from right curve), and 1091E (right curve) are Minolta data. Note that the color reflectance data from the Minolta instrument are offset from the OSU-SCAT. These two records will be intercalibrated postcruise and should not be used together at this point. All holes are horizontally offset from each other by a constant (10%). Data from the top 20 cm of each core have been removed.
