![]()
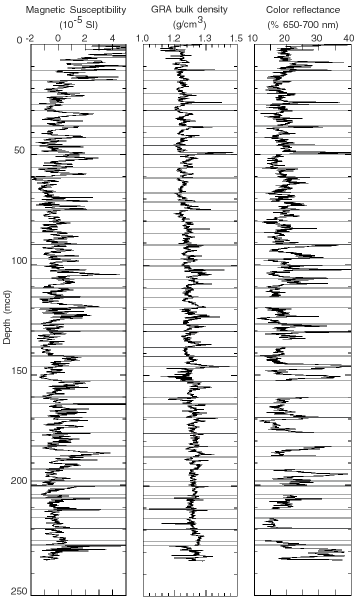
Figure F14. Spliced records of magnetic susceptibility, GRA bulk density, and color reflectance data for the upper 234 mcd of Site 1091. Only OSU-SCAT data are included in the spliced data record resulting in a number of gaps in the reflectance splice (right panel). All data sets are smoothed with a 5-point running mean. The horizontal lines in each plot identify the splice tie points.
![]()