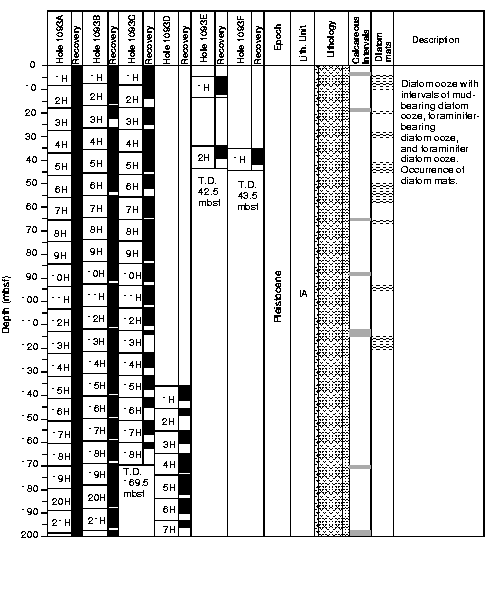
Figure F3. Lithologic summary showing core recovery, epoch, lithologic unit, graphic lithology, calcareous intervals, and diatom mats for Site 1093. Thicknesses of the calcareous intervals and diatom mats are only schematically represented, with true thicknesses and locations in each core accurately represented in the Site 1093 core correlation diagram (Fig. F5, p. 30). T.D. = total depth. (Continued on next two pages.)
