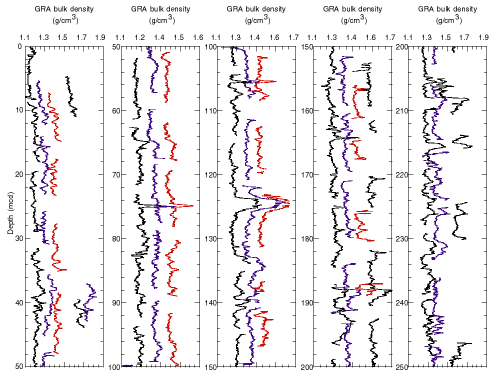
Figure F12. Smoothed (5-point average) GRA bulk density data for Site 1093. Holes 1093A through 1093F (curves arranged from left to right) are horizontally offset from each other by a constant (0.10 g/cm3). Data from the top 20 cm of most cores have been removed. Note the differences in horizontal scale.
