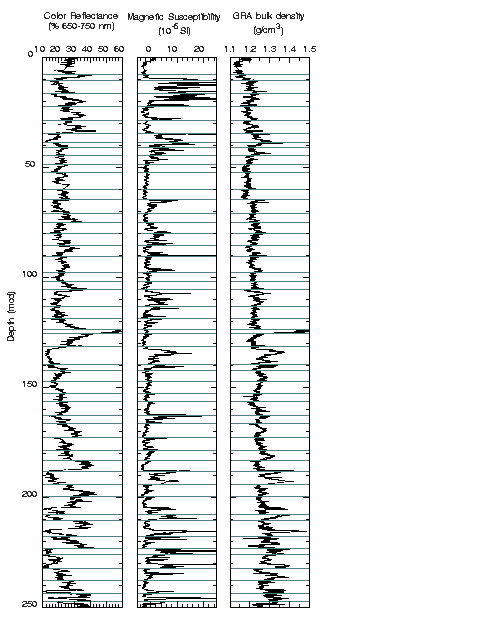
Figure F13. Spliced records of color reflectance, magnetic susceptibility, and GRA bulk density for Site 1093. All data sets were smoothed with a 5-point Gaussian filter. The horizontal lines in each plot identify the splice tie points (Table T4, p. 72).
