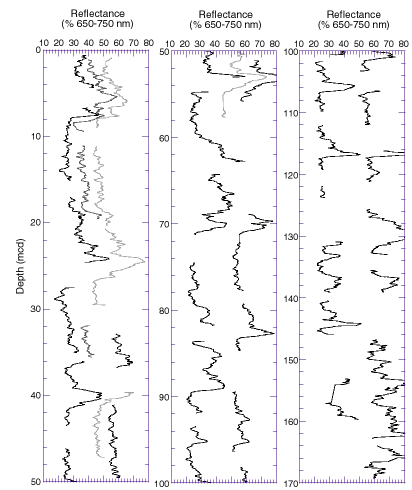
Figure F13. Smoothed (5-point average) color reflectance data (650-750 nm) for Site 1094. Holes 1094A (left curve), 1094B (second from left curve), 1094C (second from right curve), and 1094D (right curve) are horizontally offset from each other by a constant (10%). Data from the top 50 cm of these cores have been removed. Note the change in depth scale for the 100- to 170-mcd panel.

![]()