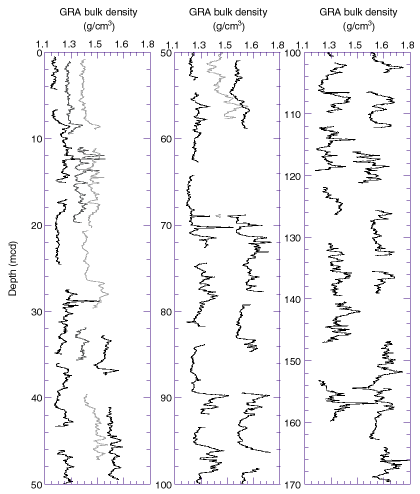
Figure F15. Smoothed (5-point average) GRA bulk density data for Site 1094. Holes 1094A (left curve), 1094B (second from left curve), 1094C (second from right curve), and 1094D (right curve) are horizontally offset from each other by a constant (0.10 g/cm3). Data from the top 50 cm of most cores have been removed. Note the change in depth scale for the 100- to 170-mcd panel.

![]()