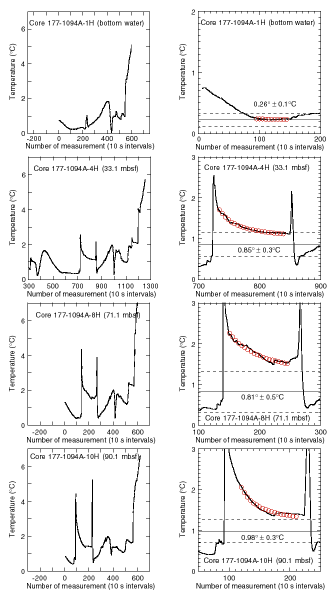
Figure F26. Downhole temperature measurements at Site 1094. Two plots are shown for each tool deployment: almost the entire time-temperature records (~1 hr) are shown on the left, and close-ups of the equilibration curves (~10 min) are shown on the right. The last deployment (158.6 mbsf) was done with the DVTP, all other deployments were done with the APCT shoe. Circles represent the model curve (APCT) or data points (DVTP) used to calculate the equilibration temperature (horizontal solid line). Uncertainties (horizontal dashed lines) were estimated visually from the condition of the equilibration curves and from multiple calculations using different curve segments. A bottom-water measurement was taken with the barrel of Core 177-1088A-1H before the core was shot. Sediment measurements were taken after the corresponding cores were shot. (Continued on next page.)

![]()