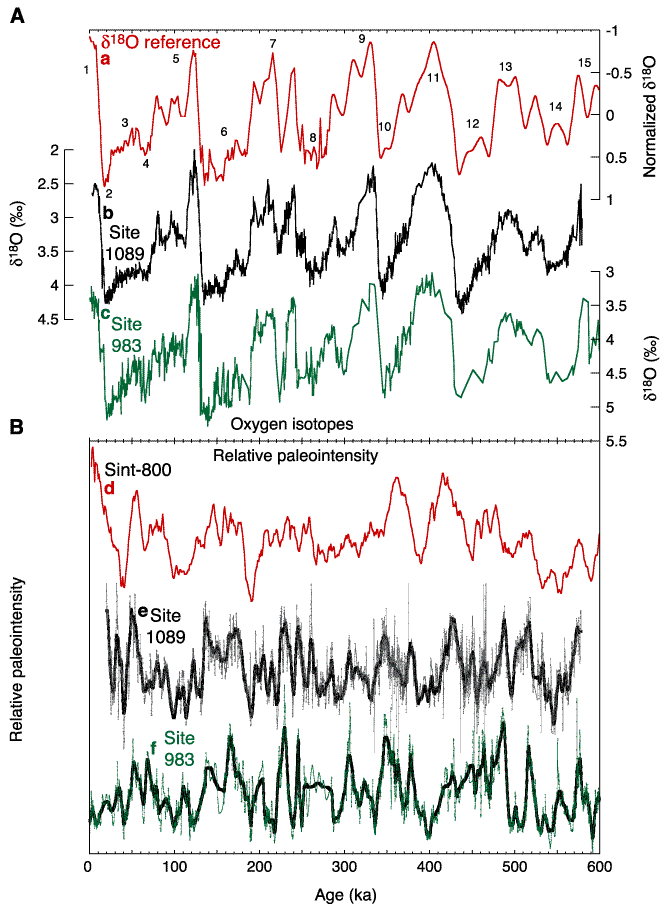
 18O reference curve [a; red line]. B. Correlation of geomagnetic paleointensity record at Site 1089 [e; black line] with Site 983 [f; green line] and the composite Sint-800 record (Guyodo and Valet, 1999) [d; red line] (after Stoner et al., in press).

![]()