![]()
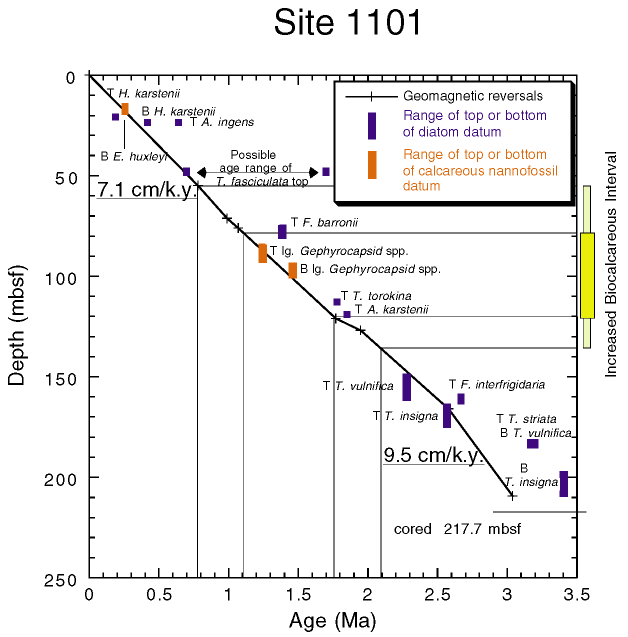
Figure F13. Depth-age profile determined from geomagnetic reversals and diatom and calcareous nannofossil datums at Site 1101. The curve fit to the paleomagnetic data is an interpolation that passes through all data points within the data set and matches the slope at those points. Diatom and calcareous nannofossil datum intervals are marked with a dark bar (diatom) and a light bar (calcareous nannofossil). B = base first occurrence, T = top last occurrence.
![]()