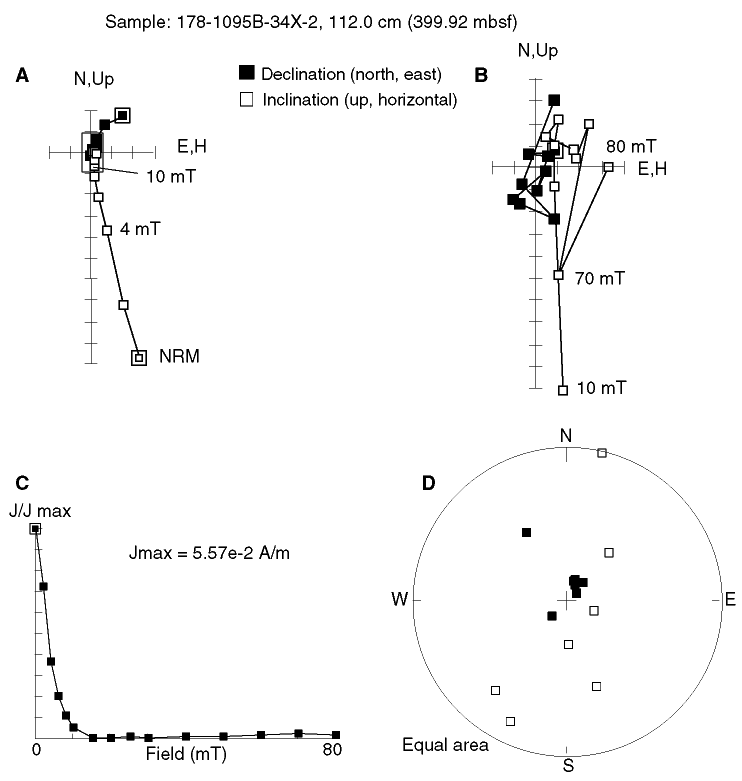
Figure F24. A. Vector end-point diagram for a sample from within the transition zone between the cryptochron and the reversed polarity interval directly above it (Sample 178-1095B-34X-2, 112 cm [399.92 mbsf]). B. Enlarged view of the boxed region from A, which illustrates that virtually no magnetization is contained within the sample after the drill-string overprint is removed. C. Change in the intensity of remanence during AF demagnetization. D. Equal-area projection of the remanence vector during AF demagnetization.

![]()