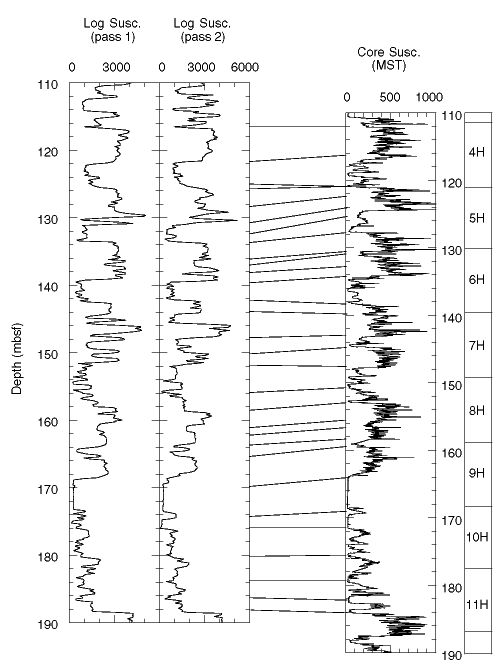
Figure F42. Comparison of susceptibility logs from the two passes of the GHMT with the core MST susceptibility measurements, for the interval 110-190 mbsf. The small discrepancies between the two susceptibility logs are likely caused by oscillations in the vertical motion of the tool.

![]()