![]()
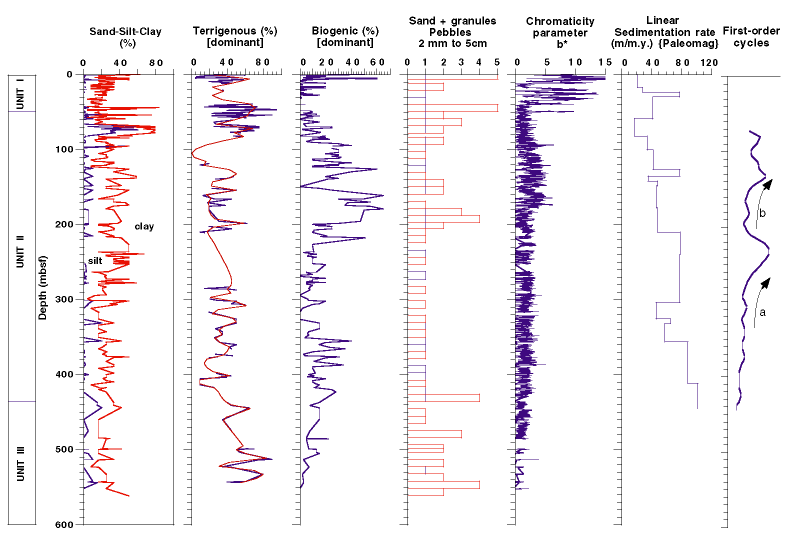
Figure F5. Comparison of downhole sedimentological data from smear slides for Site 1095. Data points (joined by lines in the three left-hand columns) are unevenly spaced: in the second column, both a straight line and a spline curve were used to join points. Linear sedimentation rate derived from paleomagnetic data. First-order cycles identified in Unit II are derived from frequency of occurrence and type of the different turbidite facies identified in Figure F4.
![]()