![]()
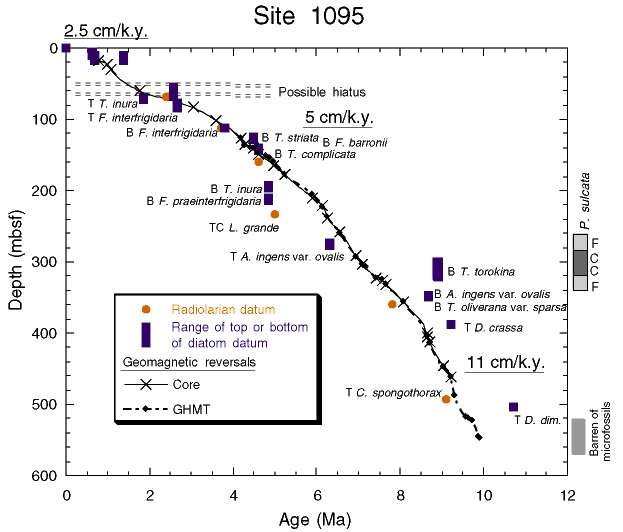
Figure F52. Depth-age profile determined from geomagnetic reversals and diatom and radiolarian datums. Paleomagnetic data were drawn from analysis of split-cores (× symbols) and GHMT logging data (diamonds). Separate curve fits for split-core (thin line) and GHMT data (heavy broken line) are interpolations that pass through all data points within the individual data set and match the slopes at those points. Intervals of diatom datums are marked with a box indicating the distance between the samples used to define the LO or FO interval. P. sulcata abundance is indicated by gray shaded bars. Radiolarian datums are indicated with a circle. In labels indicating species identity, T = last occurrence, B = first occurrence, and TC = top common occurrence. The hole is barren of microfossils below ~520 mbsf. Mean sedimentation rates (underlined) determined for three intervals show an uphole decrease.
![]()