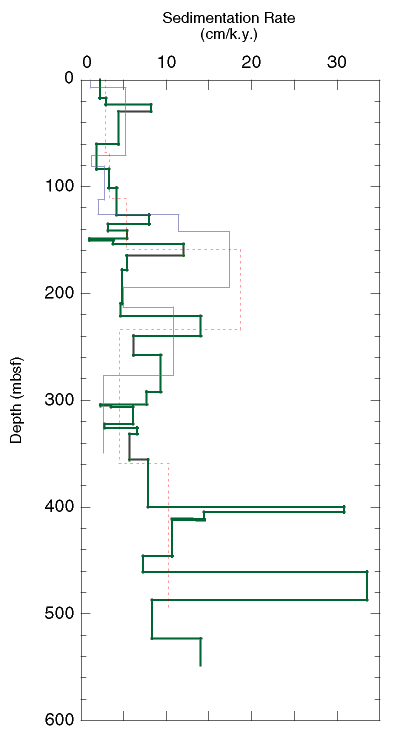
Figure F53. Sedimentation rate (cm/k.y.) vs. depth (mbsf) determined from geomagnetic polarity transitions and diatom and radiolarian datums for Site 1095. The data are given in Tables T38, T39, and T40. The heavy line represents paleomagnetic data from the combined core and GHMT data set, the dashed line indicates radiolarian data, and the thin line is diatom data. The abrupt spike in the paleomagnetic data at ~400 mbsf corresponds to an interval that has been interpreted as a cryptochron and whose absolute age and duration is not well known (see "Paleomagnetism," in "Site 1095").

![]()