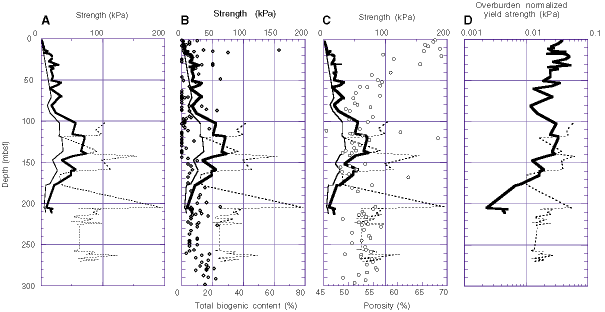
Figure F38. (A) Sediment strength, (B) strength compared with biogenic content, (C) strength compared with porosity, and (D) yield strengths normalized by overburden stress vs. depth. Thin solid lines = residual strengths of the sediments from the vane shear equipment, heavy solid lines = vane shear yield strengths, dashed lines = yield strengths obtained using the pocket penetrometer, diamonds = biogenic content, circles = porosity.

![]()