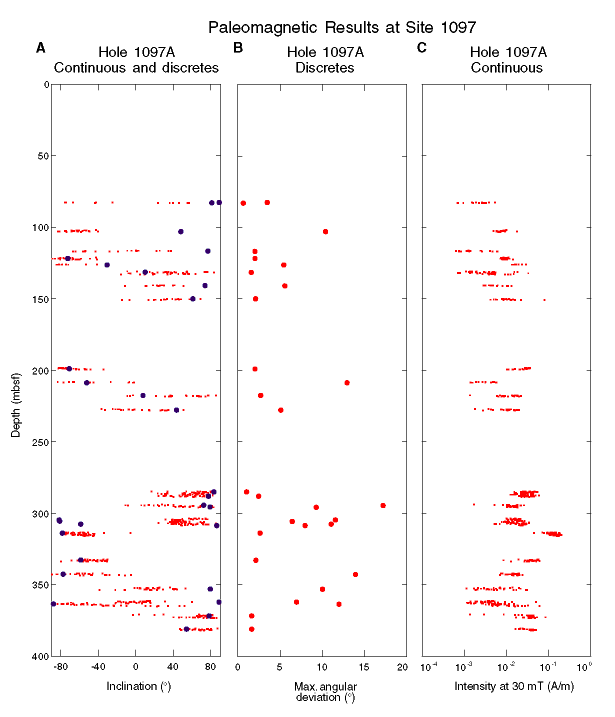
Figure F16. A. Inclination of the magnetization vector at the 30-mT demagnetization step from split cores (small ×'s) compared with mean inclinations obtained from principal component analysis of discrete samples (large circles). B. Maximum angular deviations obtained from principal component analysis of discrete samples. C. Intensity of remanence vs. depth after AF demagnetization at 30 mT.

![]()