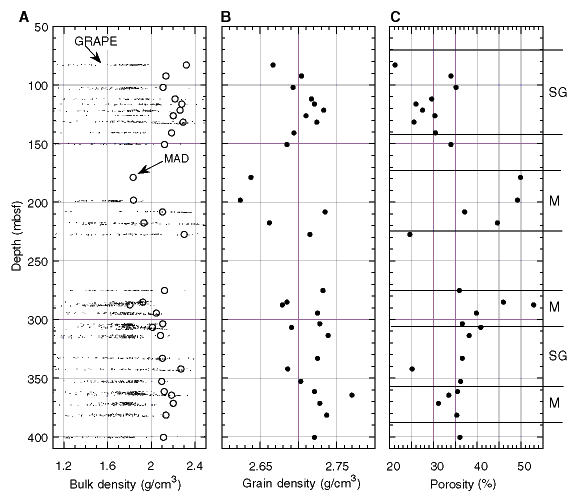
Figure F24. Index properties plots. A. Moisture and density (MAD) bulk density data (circles) and GRAPE bulk density (dots). B. Grain density. C. Porosity. Intervals suggested as subglacial (see "Lithostratigraphy," in "Site 1097" chapter) are marked SG, and those interpreted as marine/glaciomarine are marked M.

![]()