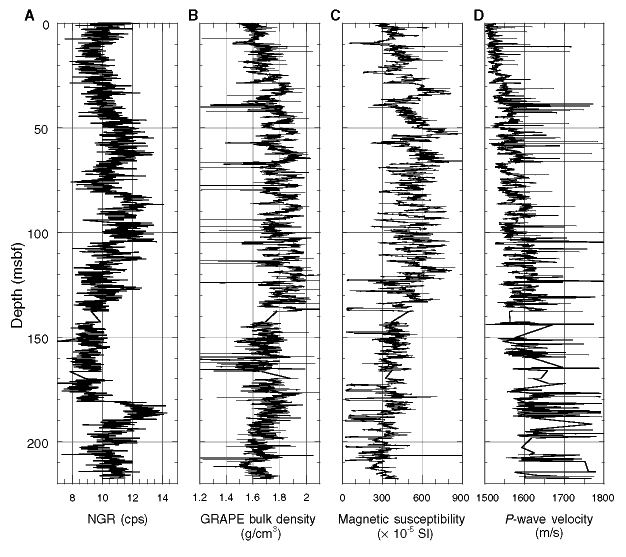
Figure F25. Raw data for (A) NGR, (B) GRAPE density, (C) magnetic susceptibility, and (D) P-wave velocity. GRAPE data were truncated at 1.2 g/cm3, susceptibility data were truncated at 0, and P-wave velocity data were truncated at 1800 and 1450 m/s to remove equipment noise.

![]()