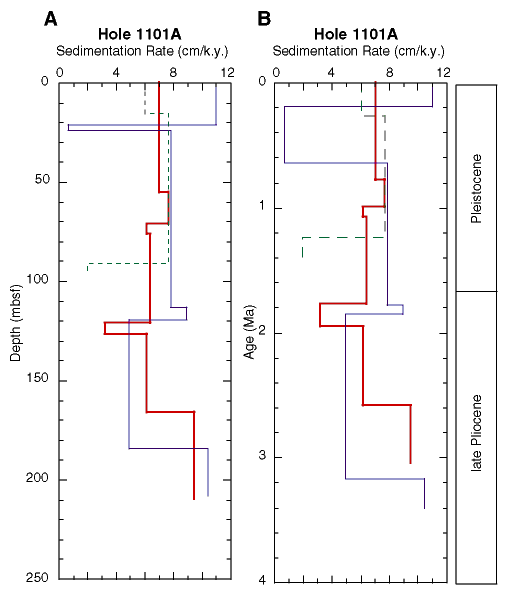
Figure F35. A. Sedimentation rate (cm/k.y.) vs. depth (mbsf). B. Sedimentation rate (cm/k.y.) vs. age (Ma). In both figures, the thick solid line represents paleomagnetic data, the thin solid line represents diatom datums, and the broken line represents calcareous nannofossil datums.

![]()