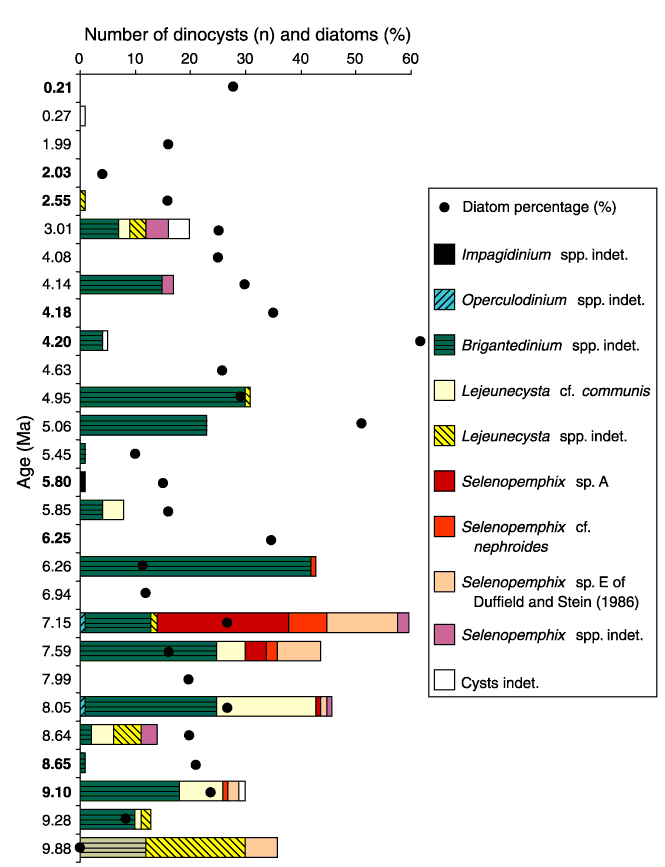
Figure F2. Cumulative bar chart of the occurrence of dinoflagellate cysts, plotted against age. Diatom percentage is also shown by black circles on the same scale. Samples from bioturbated intervals are shown in bold type on the age scale; samples from laminated intervals are in light type.

![]()