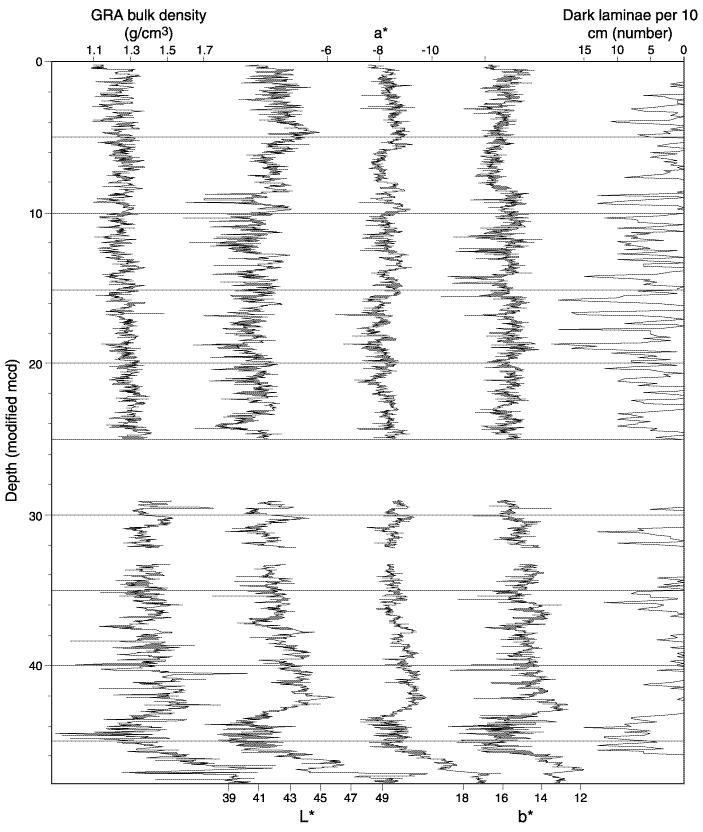
Figure F3. Color variables for the spliced record as in Figure F2, compared to shipboard GRA bulk density measurements and the number of dark laminae counted in each 10-cm interval. To allow estimation of product moment correlation coefficients, color variables were calculated as the average value in a centimeter interval centered around the GRA measurements. Correlation coefficients of GRA bulk density with L* = 0.46, of a* with L* = -0.84, and of b* with L* = -0.42. Note that scales of a*, b*, and number of laminae are inverted to facilitate visual comparison of trends and that turbidites between ~25 and ~29 mcd and ~32 and ~33 mcd are not included in the data.

![]()