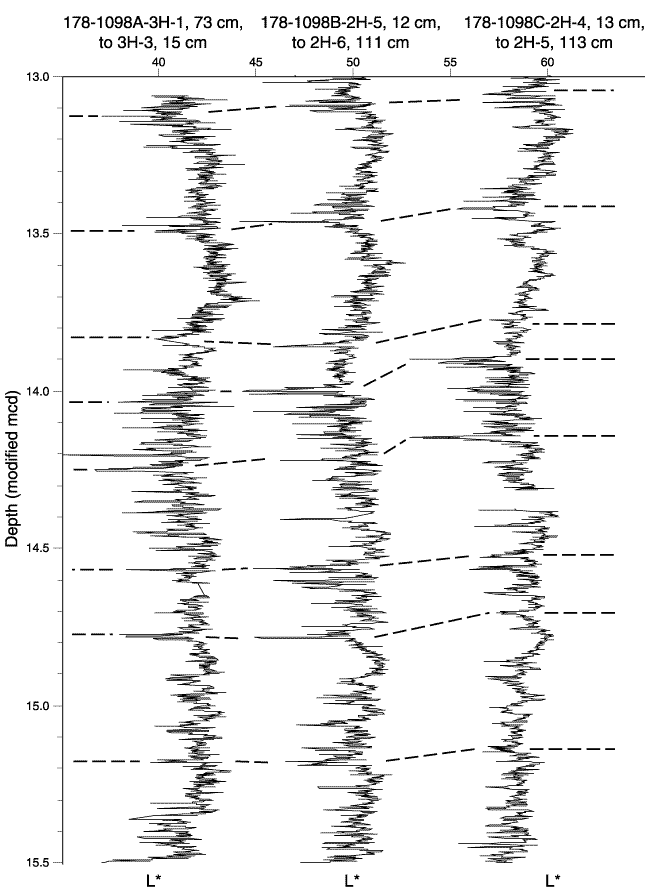
Figure F4. Detail of L* trends in all three holes between 13 and 15.5 mcd as a representative example of the record between 0 and 25 mcd, showing lateral continuity of bundles of laminae. Plotted are the 1-mm-resolution L* time series after smoothing with a 3-point moving average. Dotted lines trace the correlation of individual laminae between holes.

![]()