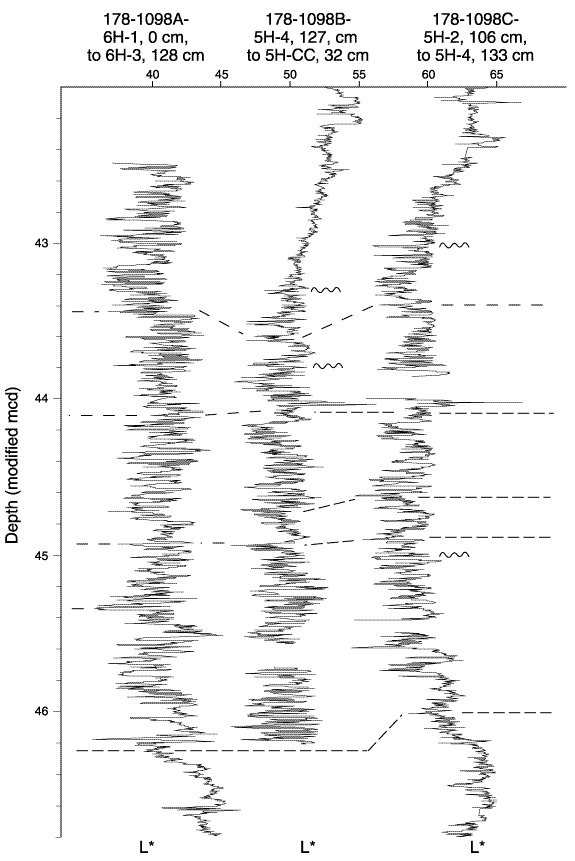
Figure F6.
Detail of L* trends in all three holes for the laminated interval between ~43 and 46 mcd. Note that all three holes have similar long-term trends in sediment lightness, but that a good correlation between individual laminae is possible only for Holes 1098B and 1098C in the interval between 44.1 and 45.5 mcd. Plotted are the 1-mm-resolution L* time series after smoothing with a 3-point moving average; gaps between sections in Hole 1098C correspond to whole-core interstitial water samples. Dotted lines trace the correlation of long-term ( 10 cm) variation in color; wavy lines show the position of possible discontinuities as indicated by slump features or angular disconformities.

![]()