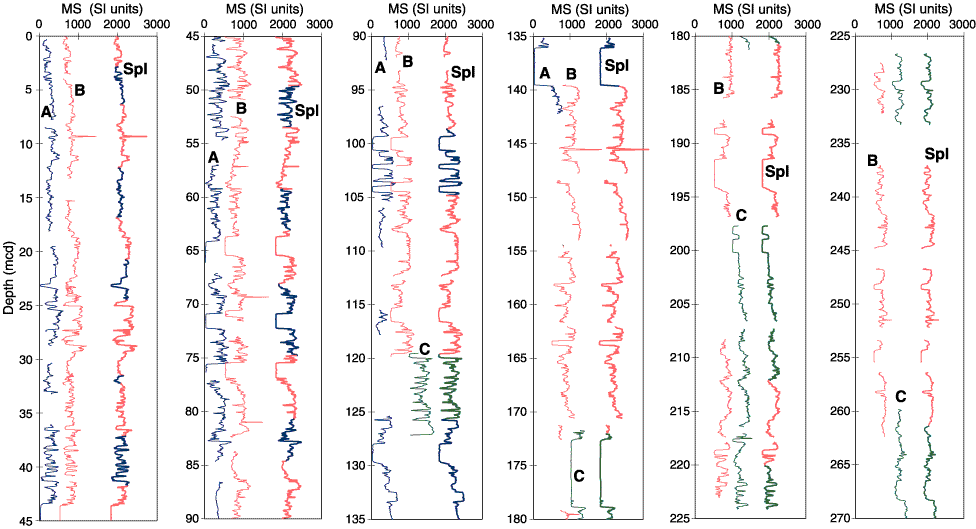
Figure F2. Magnetic susceptibility (MS) for Holes 1096A, 1096B, 1096C, and the spliced sections plotted against depth to 270 mcd (labeled A, B, C, and Spl, respectively). Colors of the spliced MS curve reflect the origins of the spliced sections. The MS scale is correct for values from Hole 1096A; values for other holes and the spliced sections are offset to aid comparison.

![]()