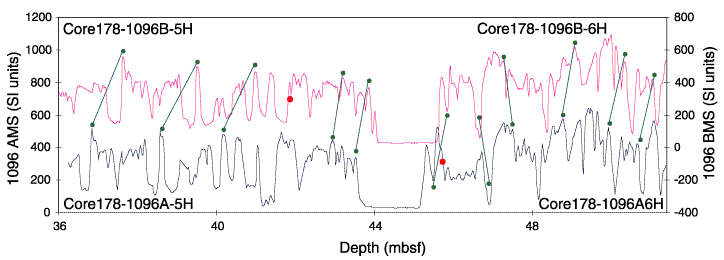
Figure F4. Comparison of magnetic susceptibility (MS) between 36 and 51 mbsf at Site 1096. Hole 1096A = blue, Hole 1096B = pink. Red circles = positions of core boundaries, green lines = specimen correlations. Note the low MS values in both holes around 45 mbsf.

![]()