![]() Figures F1-F8
Figures F1-F8
![]() Table
T1
Table
T1
F1. Location map for Sites 1101, 1095, and 1096.
F2. Frequency of pebbles vs. depth.
F3. Simplified lithology by percentage of pebbles by unit.
F4. Percentage of pebble shapes by unit.
F5. Shape vs. lithology for all pebbles analyzed.
F6. Visual roundness of pebbles by unit.
F7. Intercept sphericity and visual roundness of pebbles.
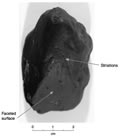
F8. Example of data from a basally transported pebble.
T1. Lithology, roundness, sphericity, shape, and surface texture of pebbles.