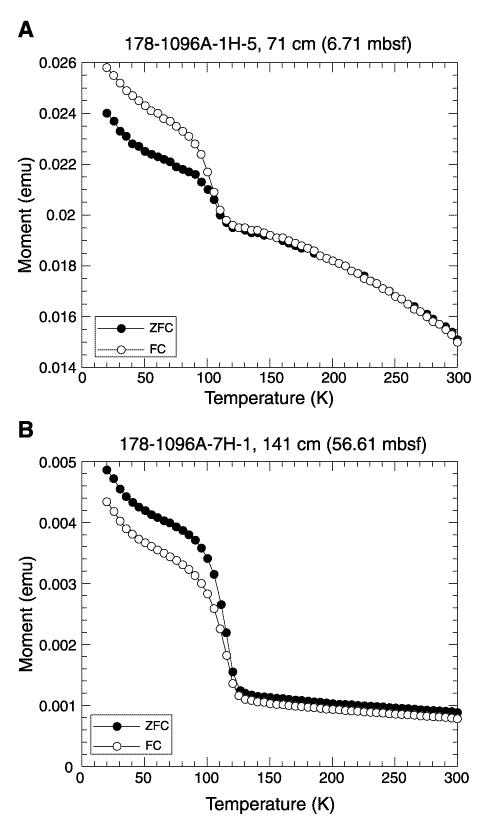
Figure F2. A. Zero field cooled (ZFC) and field cooled (FC) MR-T curves for Sample 178-1096A-1H-5, 71 cm (6.71 mbsf). The FC curve is higher than the ZFC curve, consistent with SSD particles, possibly of biogenic origin. B. ZFC-FC curves for Sample 178-1096A-7H-1, 141 cm (56.61 mbsf). The ZFC curve is lower than the FC curve, consistent with MD magnetite.

![]()