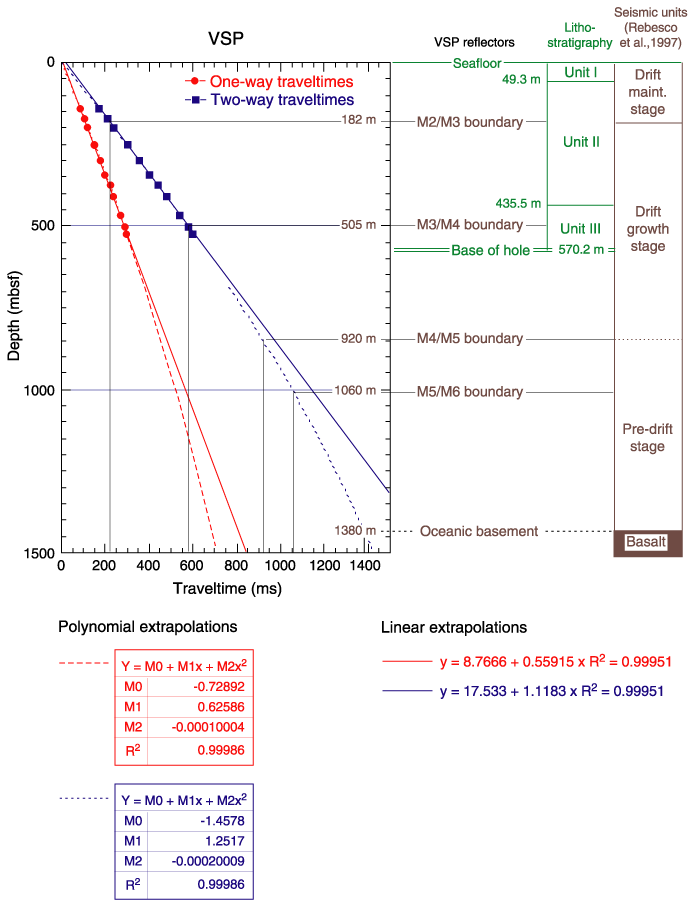
Figure F11. Plot of traveltime and subbottom depth from the in situ velocity check shots for Site 1095. The equations of two velocity functions (linear and second-order polynomial) are provided. The diagram to the right summarizes the relationships in depth between lithostratigraphic and seismostratigraphic units.

![]()