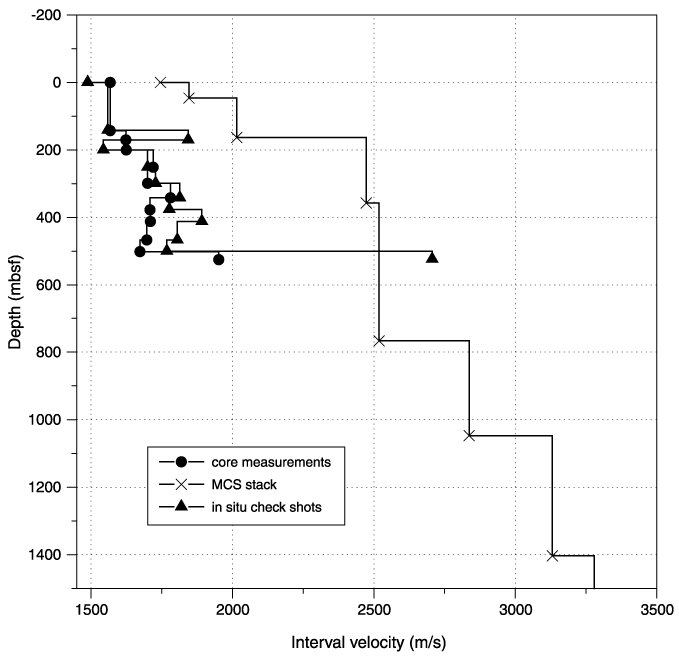
Figure F6. Comparison among interval velocities obtained with the in situ velocity check shots (during vertical seismic profiling), nearest available stacking velocities on MCS data, and velocity measured on cores (Fig. F5) reduced to interval velocities with same intervals as velocity check shots for Site 1095 (see Table T1). See "Results."

![]()