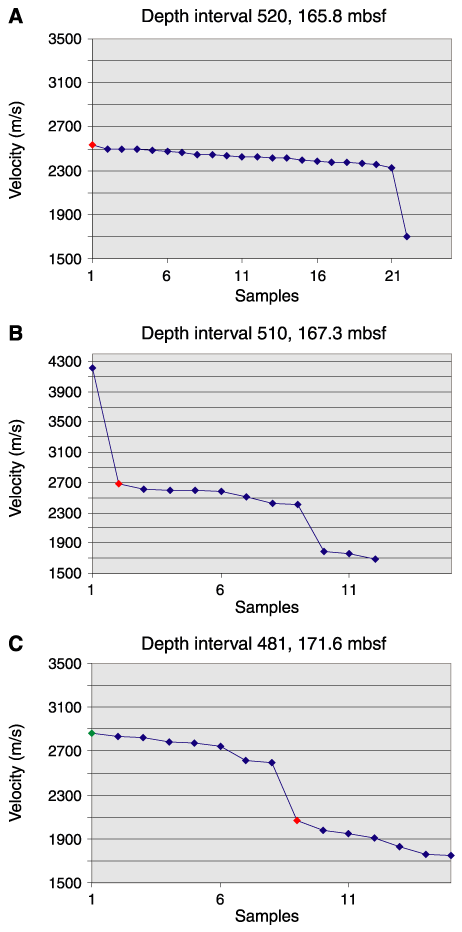
Figure F5. The data categories AFA1(LTT1, -2, -3, -4; TT1, -2, -3, -4), AFA1(LTT1, -2, -3, -4; TT1, -2, -3, -4) high, as well as AFA2(LTT1, -2, -3, -4) and AFA2(LTT1, -2, -3, -4) high, are the result of a statistical and combinatorial processing approach. We calculated differential transit times for all available transmitter and receiver spacings (LTT1, -2, -3, -4 and TT1, -2, -3, -4) based on analog picked first arrivals. As a guide for decision making, all resulting velocity combinations were sorted in descending order and plotted into small graphs for most of the depth intervals. Four cases are common. A. Typically, the values have a stable plateau at the high-velocity side and only some anomalies at the low side of the values. B. In several depth intervals, we also observe erratic velocities at the high end of the velocity spectrum. C. However, depth intervals with two distinct bimodal velocity populations and depth intervals with no velocities within the plausibility range of 1500-6000 m/s are also observed.

![]()